Electrify Chicago
An independent tool for viewing City of Chicago building data
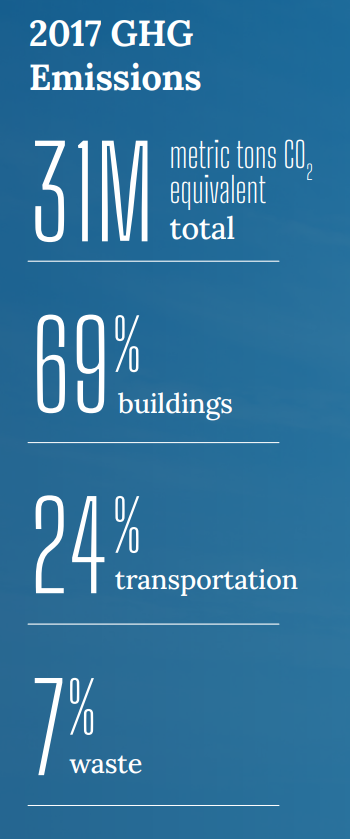
According to the
2022 Chicago Climate Action Plan ,
a whopping 69% of Chicago's emissions come from buildings, making it
our biggest challenge and our biggest opportunity as a city to tackle
change. At Electrify Chicago, we want to showcase some of the best and worst performing
buildings in the city using publicly available data and manual annotations to add
building photographs and label multi-building owners like universities.
,
a whopping 69% of Chicago's emissions come from buildings, making it
our biggest challenge and our biggest opportunity as a city to tackle
change. At Electrify Chicago, we want to showcase some of the best and worst performing
buildings in the city using publicly available data and manual annotations to add
building photographs and label multi-building owners like universities.
You can start by looking at Chicago's buildings with the highest greenhouse gas intensity - this means that they use the most energy when adjusted per unit of square foot, so big buildings could actually perform much better than very inefficient small buildings on this metric.
New Article
📰 $30 Million In Missed Fines
The City Of Chicago failed to collect $30 million in potential fines from the building benchmarking ordinance, reducing transparency and accountability.
Legislative update! 🎉
As of late January 2024, legislation is being introduced to require new use more efficient forms of water and space heating, via the Clean And Affordable Buildings Ordinance (CABO), which will reduce the number of highly polluting and inefficient buildings that end up on this site.
If you're in Chicago,
write to your alderman to support the CABO!
Chicago Buildings by Greenhouse Gas Intensity
Note: Data only includes large Chicago buildings from 2021, unless explicitly stated otherwise.
Note: This data only includes buildings whose emissions are reported
under the
Chicago Energy Benchmarking Ordinance. According to the City “As of 2016,
this list includes all commercial, institutional, and residential buildings larger than
50,000 square feet.” This dataset is also then filtered to only buildings with
reported emissions > 1,000 metric tons CO2 equivalent.
This data is also from 2021, but when new benchmark data is available, we'll update the site.
| Property Name / address | Primary Property Type |
Greenhouse Gas Intensity (kg CO2 eq./sqft) |
Total Greenhouse Emissions (metric tons CO2 eq.) |
|---|---|---|---|
|
Eli Whitney Elementary School
(CPS)
2815 S Komensky Ave
| K-12 School | 6.6 kg/sqft
Highest 47%
| 712 tons
Lowest 42%
|
|
DeWitt Clinton Elementary School
(CPS)
6110 N Fairfield Ave
| K-12 School | 6.6 kg/sqft
Highest 47%
| 898 tons
Highest 49%
|
|
Peter A Reinberg Elementary School
(CPS)
3425 N Major Ave
| K-12 School | 6.6 kg/sqft
Highest 47%
| 605 tons
Lowest 35%
|
|
Burnham Elementary Inclusive Academy
(CPS)
9928 S Crandon Ave
| K-12 School | 6.6 kg/sqft
Highest 47%
| 541 tons
Lowest 30%
|
|
737 W Washington Blvd
737 W Washington Blvd
| Multifamily Housing | 6.6 kg/sqft
Highest 47%
| 5,399 tons
Highest 6%
|
|
314 West Superior Street
314 W Superior St
| Office | 6.6 kg/sqft
Highest 47%
| 722 tons
Lowest 43%
|
|
Hilliard Homes Phase I Limited Partnership (Family)
2031 S Clark St
| Multifamily Housing | 6.6 kg/sqft
Highest 47%
| 1,152 tons
Highest 40%
|
|
One Museum Park West Condominium Association
1201 S Prairie Ave
| Multifamily Housing | 6.6 kg/sqft
Highest 47%
| 4,321 tons
Highest 8%
|
|
Whitechapel Apartments
4900 N SHERIDAN RD
| Multifamily Housing | 6.6 kg/sqft
Highest 47%
| 838 tons
Lowest 48%
|
|
Romanian Village
5161 N ASHLAND AVE
| Multifamily Housing | 6.6 kg/sqft
Highest 47%
| 459 tons
Lowest 23%
|
|
StMaryAngels_School
1850 N Hermitage Ave
| K-12 School | 6.6 kg/sqft
Highest 47%
| 282 tons
Lowest 8%
|
|
Spertus Institute for Jewish Learning and Leadership
610 S Michigan Ave
| College/University | 6.6 kg/sqft
Highest 47%
| 948 tons
Highest 47%
|
|
1104 S Wabash
1104 S Wabash Ave
| College/University | 6.6 kg/sqft
Highest 47%
| 1,094 tons
Highest 42%
|
|
Elm Street Plaza Venture LLLP
1130 N Dearborn St
| Multifamily Housing | 6.6 kg/sqft
Highest 47%
| 2,510 tons
Highest 17%
|
|
73rd St Apts., LLC
7345 S South Shore Dr
| Multifamily Housing | 6.6 kg/sqft
Highest 47%
| 702 tons
Lowest 41%
|
Data Source:
Chicago Energy Benchmarking Data